The Becker Friedman Institute for Economics (BFI) serves as a hub for cutting-edge analysis and research across the entire University of Chicago economics community, uniting researchers from the Booth School of Business, the Kenneth C. Griffin Department of Economics, the...
Inspired by our namesakes, Nobel Laureates Gary Becker and Milton Friedman, who believed that economics research could help improve the world, BFI works with the Chicago Economics community to turn its evidence-based research into real-world impact.
The Predoctoral Research in Economics Program (PREP) is intended to serve as a bridge between college and graduate school for students interested in empirical economics. The program offers unique research and professional training opportunities at the University of Chicago.
Expanding Discovery in Economics+ (EDE+) brings together a diverse group of early undergraduate students to hone their research abilities and technical skills.
We examine the role of central bank reserves and public liquidity when secondary markets may freeze. Central bank reserves help intermediaries purchase assets during stress but crowd out investment. Under laissez-faire, intermediaries hold insufficient reserves, overlooking how aggregate liquidity reduces...
Cesar Chavez Padilla, Shuaizhang Feng, James Heckman, and Zhe Yang
Using rich data on Chinese schoolchildren, we study the relationships of IQ and personality traits with children’s risk preferences and how they affect the precision with which those preferences are measured. Our structural model separates preferences from deliberation noise and...
Juanma Castro-Vincenzi, Adry Gracio, Gaurav Khanna, and Nitya Pandalai-Nayar
We study how aggregate risk shapes production, trade, and input sourcing in complex supply chains. We develop a quantitative model of sequential production under risk, where each stage sources inputs from multiple origins. Analytically, we first show that sourcing shares...
Captivating and informative videos on the latest insights and trends as well as the tested stock of knowledge in economics from leaders in academia, policy, business, and the media.
In the United States, regulators inspect nursing homes to ensure compliance with quality, safety, and other standards. While these inspections...
BFI Data Studio·Nov 6, 2025
Unlocking the Power of Markets as a New Tool for Regulating Pollution
Michael Greenstone, Rohini Pande, Nicholas Ryan, and Anant Sudarshan
How the world’s first particulate pollution market in India reduced pollution and increased industry profits.
BFI Data Studio·Nov 5, 2025
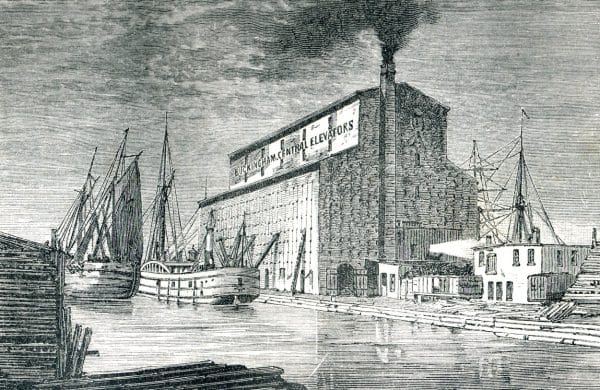
Explore Historical Manufacturing Data
Richard Hornbeck, Anders Humlum, and Martin Rotemberg
In this project, UChicago and NYU economists Richard Hornbeck, Anders Humlum, and Martin Rotemberg have led efforts to digitize the...
Topics:
Wealth250
BFI Data Studio·Sep 11, 2025
The Hidden Volatility of American Workers’ Paychecks
Most US workers experience substantial month-to-month fluctuations in pay, even within ongoing employment relationships, leading to fluctuating household consumption and...
BFI Data Studio·Sep 2, 2025
Why Has Regional Income Convergence in the U.S. Declined?
Income gaps between states have stopped narrowing at the same time that rising housing costs—linked to increased zoning restrictions—have reshaped...
BFI Data Studio·Aug 1, 2025
Building Costs and House Prices
New research challenges the common belief that construction costs drive housing prices, showing their impact has been modest — and...
BFI Data Studio·May 15, 2025
Separation of Church and State Curricula? Examining Public and Religious Private School Textbooks
Anjali Adukia and Emileigh Harrison
Public school textbooks from Texas and California contain similar content, while religious school textbooks have less female representation, feature lighter-skinned...
The Becker Friedman Institute for Economics (BFI) serves as a hub for cutting-edge analysis and research across the entire University of Chicago economics community, uniting researchers from the Booth School of Business, the Kenneth C. Griffin Department of Economics, the...
Inspired by our namesakes, Nobel Laureates Gary Becker and Milton Friedman, who believed that economics research could help improve the world, BFI works with the Chicago Economics community to turn its evidence-based research into real-world impact.
The Predoctoral Research in Economics Program (PREP) is intended to serve as a bridge between college and graduate school for students interested in empirical economics. The program offers unique research and professional training opportunities at the University of Chicago.
Expanding Discovery in Economics+ (EDE+) brings together a diverse group of early undergraduate students to hone their research abilities and technical skills.
We examine the role of central bank reserves and public liquidity when secondary markets may freeze. Central bank reserves help intermediaries purchase assets during stress but crowd out investment. Under laissez-faire, intermediaries hold insufficient reserves, overlooking how aggregate liquidity reduces...
Cesar Chavez Padilla, Shuaizhang Feng, James Heckman, and Zhe Yang
Using rich data on Chinese schoolchildren, we study the relationships of IQ and personality traits with children’s risk preferences and how they affect the precision with which those preferences are measured. Our structural model separates preferences from deliberation noise and...
Juanma Castro-Vincenzi, Adry Gracio, Gaurav Khanna, and Nitya Pandalai-Nayar
We study how aggregate risk shapes production, trade, and input sourcing in complex supply chains. We develop a quantitative model of sequential production under risk, where each stage sources inputs from multiple origins. Analytically, we first show that sourcing shares...
Captivating and informative videos on the latest insights and trends as well as the tested stock of knowledge in economics from leaders in academia, policy, business, and the media.