


In recent years, researchers and the business media have focused attention on superstar firms, or that small set of top companies that account for a large share of output. However, though we understand a good deal about the current make-up of these firms, questions persist about how these firms are born, and whether/how these firms attain their superstar status over time.
In this work, the authors collect new data to conduct an extensive analysis of the largest US companies over the past century. These data include the 2018 Fortune list (a recent example year before COVID), which covers the largest 1,000 companies by sales across all sectors; the first Fortune list in 1955, which covers the largest 500 industrial (i.e., manufacturing and mining) companies by sales; Fortune lists of top retailers and wholesalers; and a list of the largest 500 industrials by assets in 1917. The authors also research the origin story for each firm using extant resources.
For reference, the authors use “superstar firms” to denote large companies that have achieved an extraordinary size relative to other businesses (for example, total sales of the top 1,000 firms in the 2018 Fortune list exceed 40% of U.S. private sector gross output). A review of the data reveals the following:
Industrials
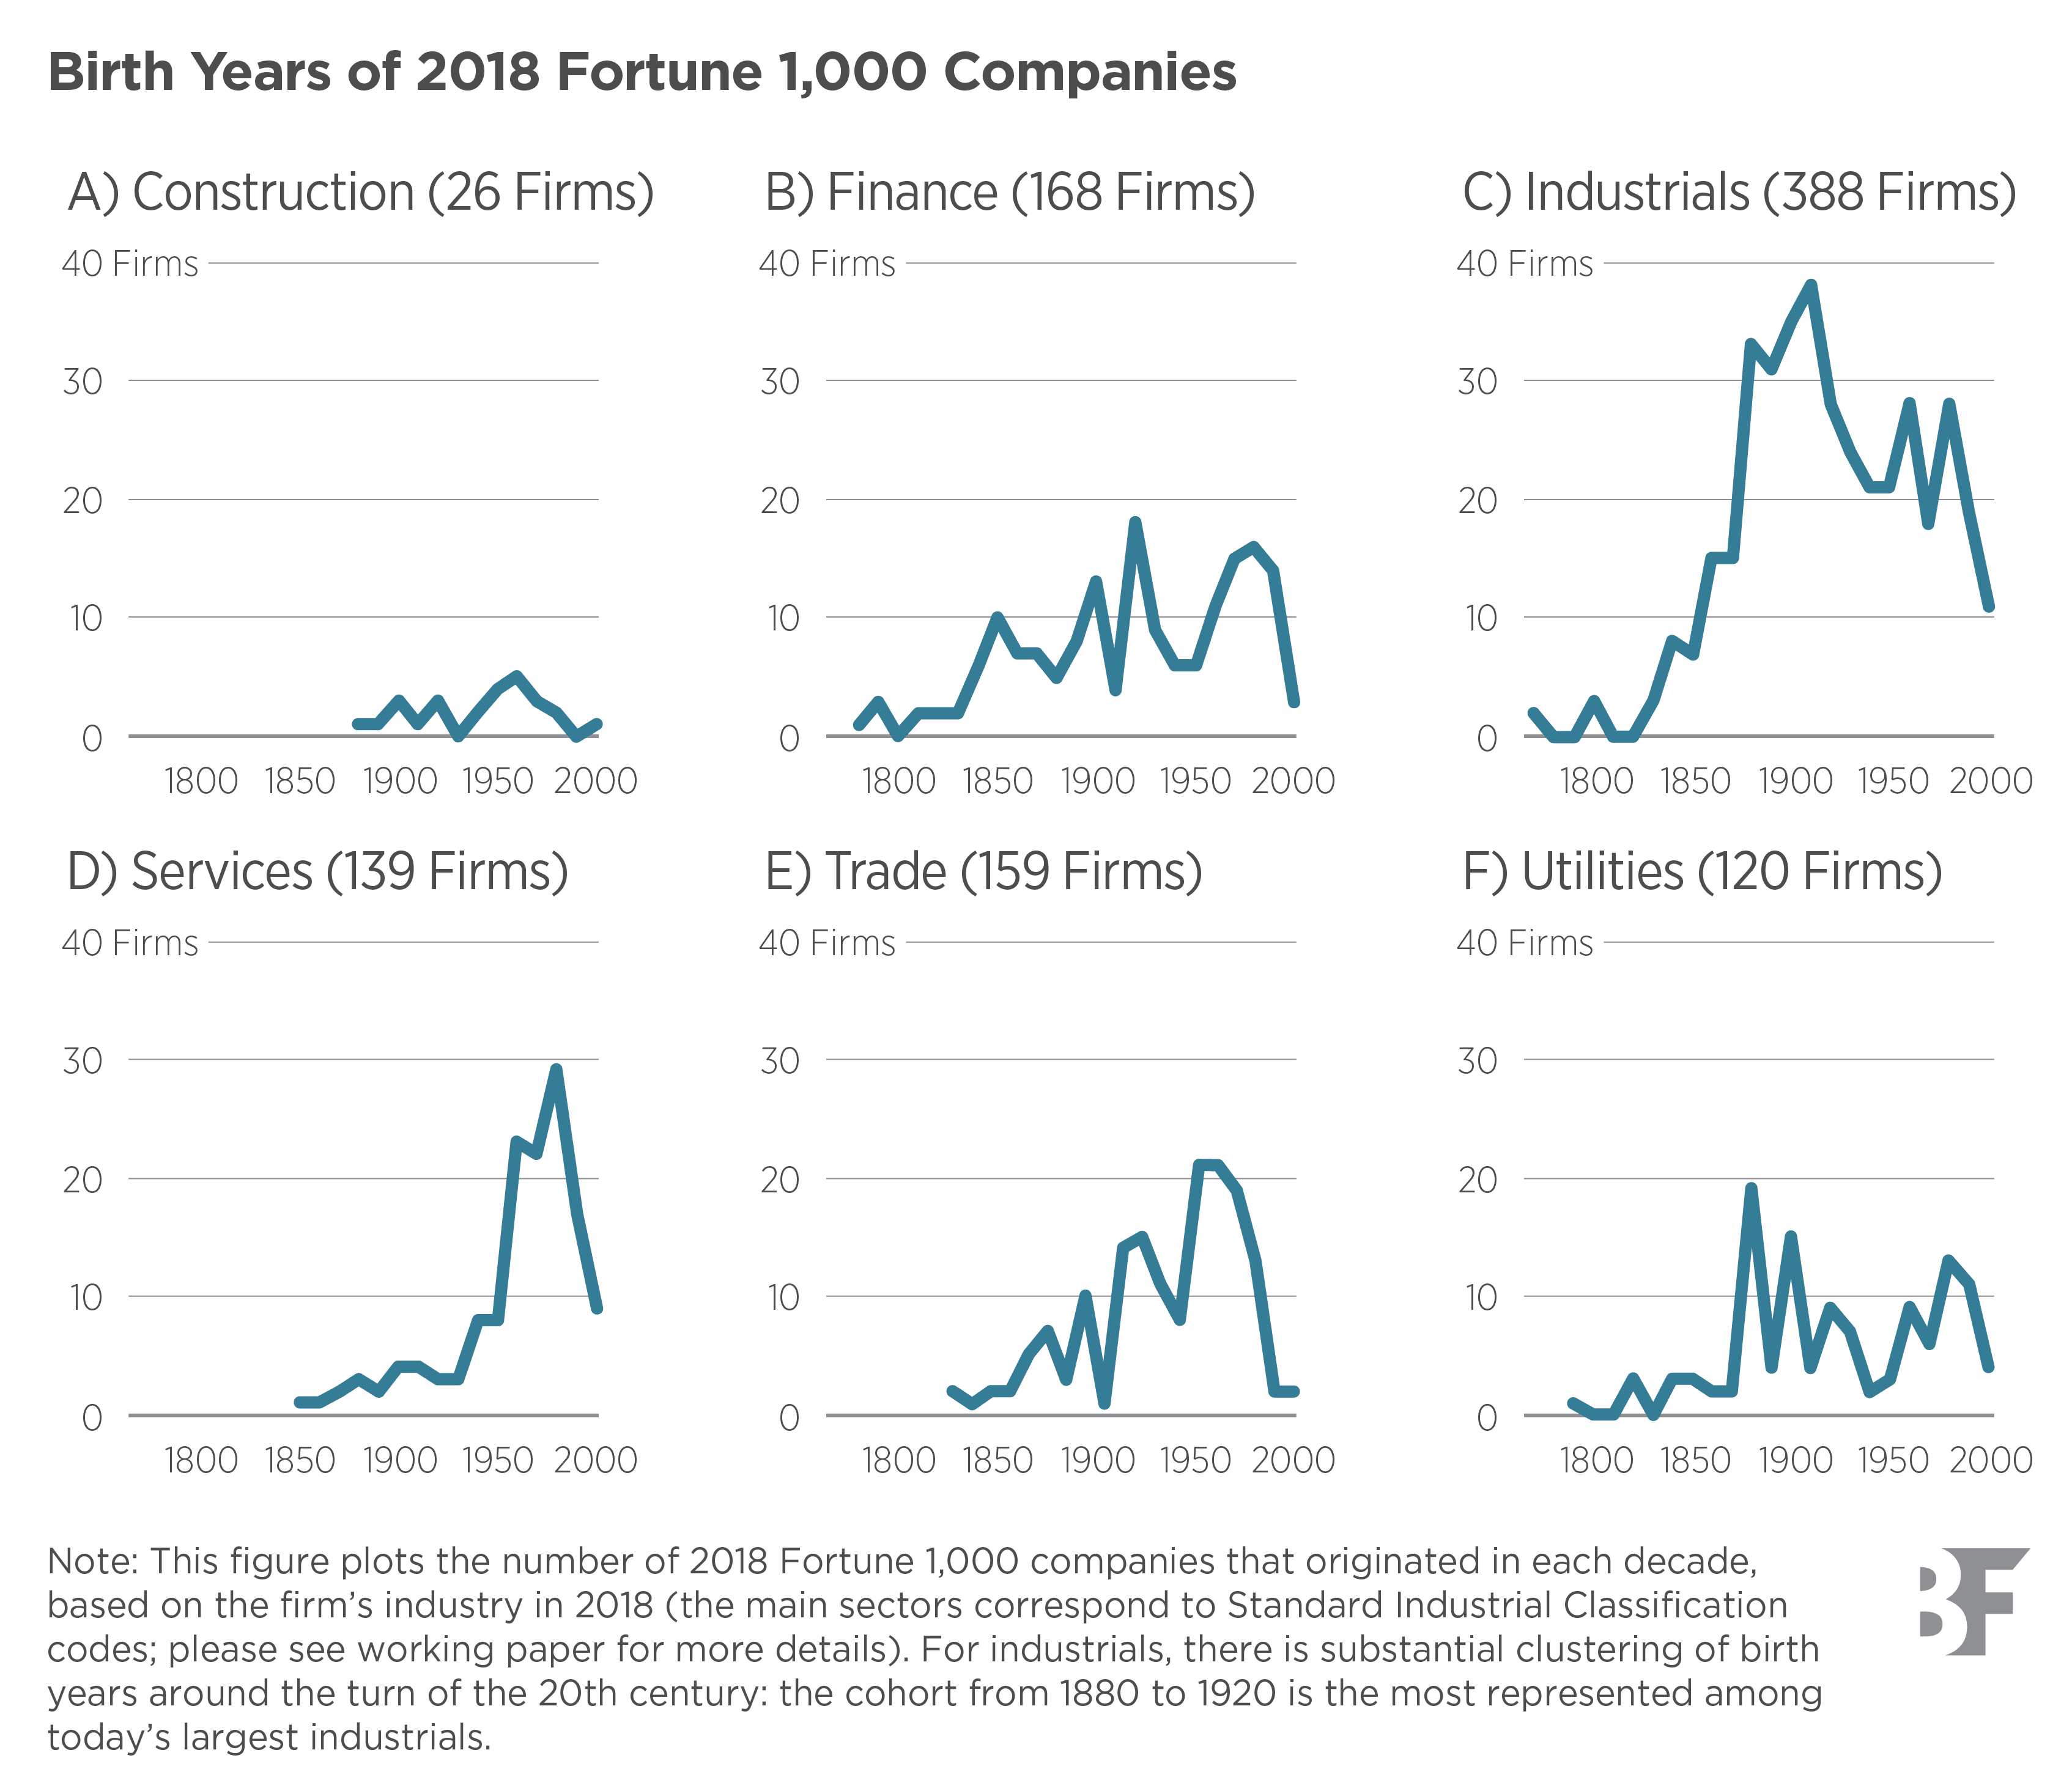
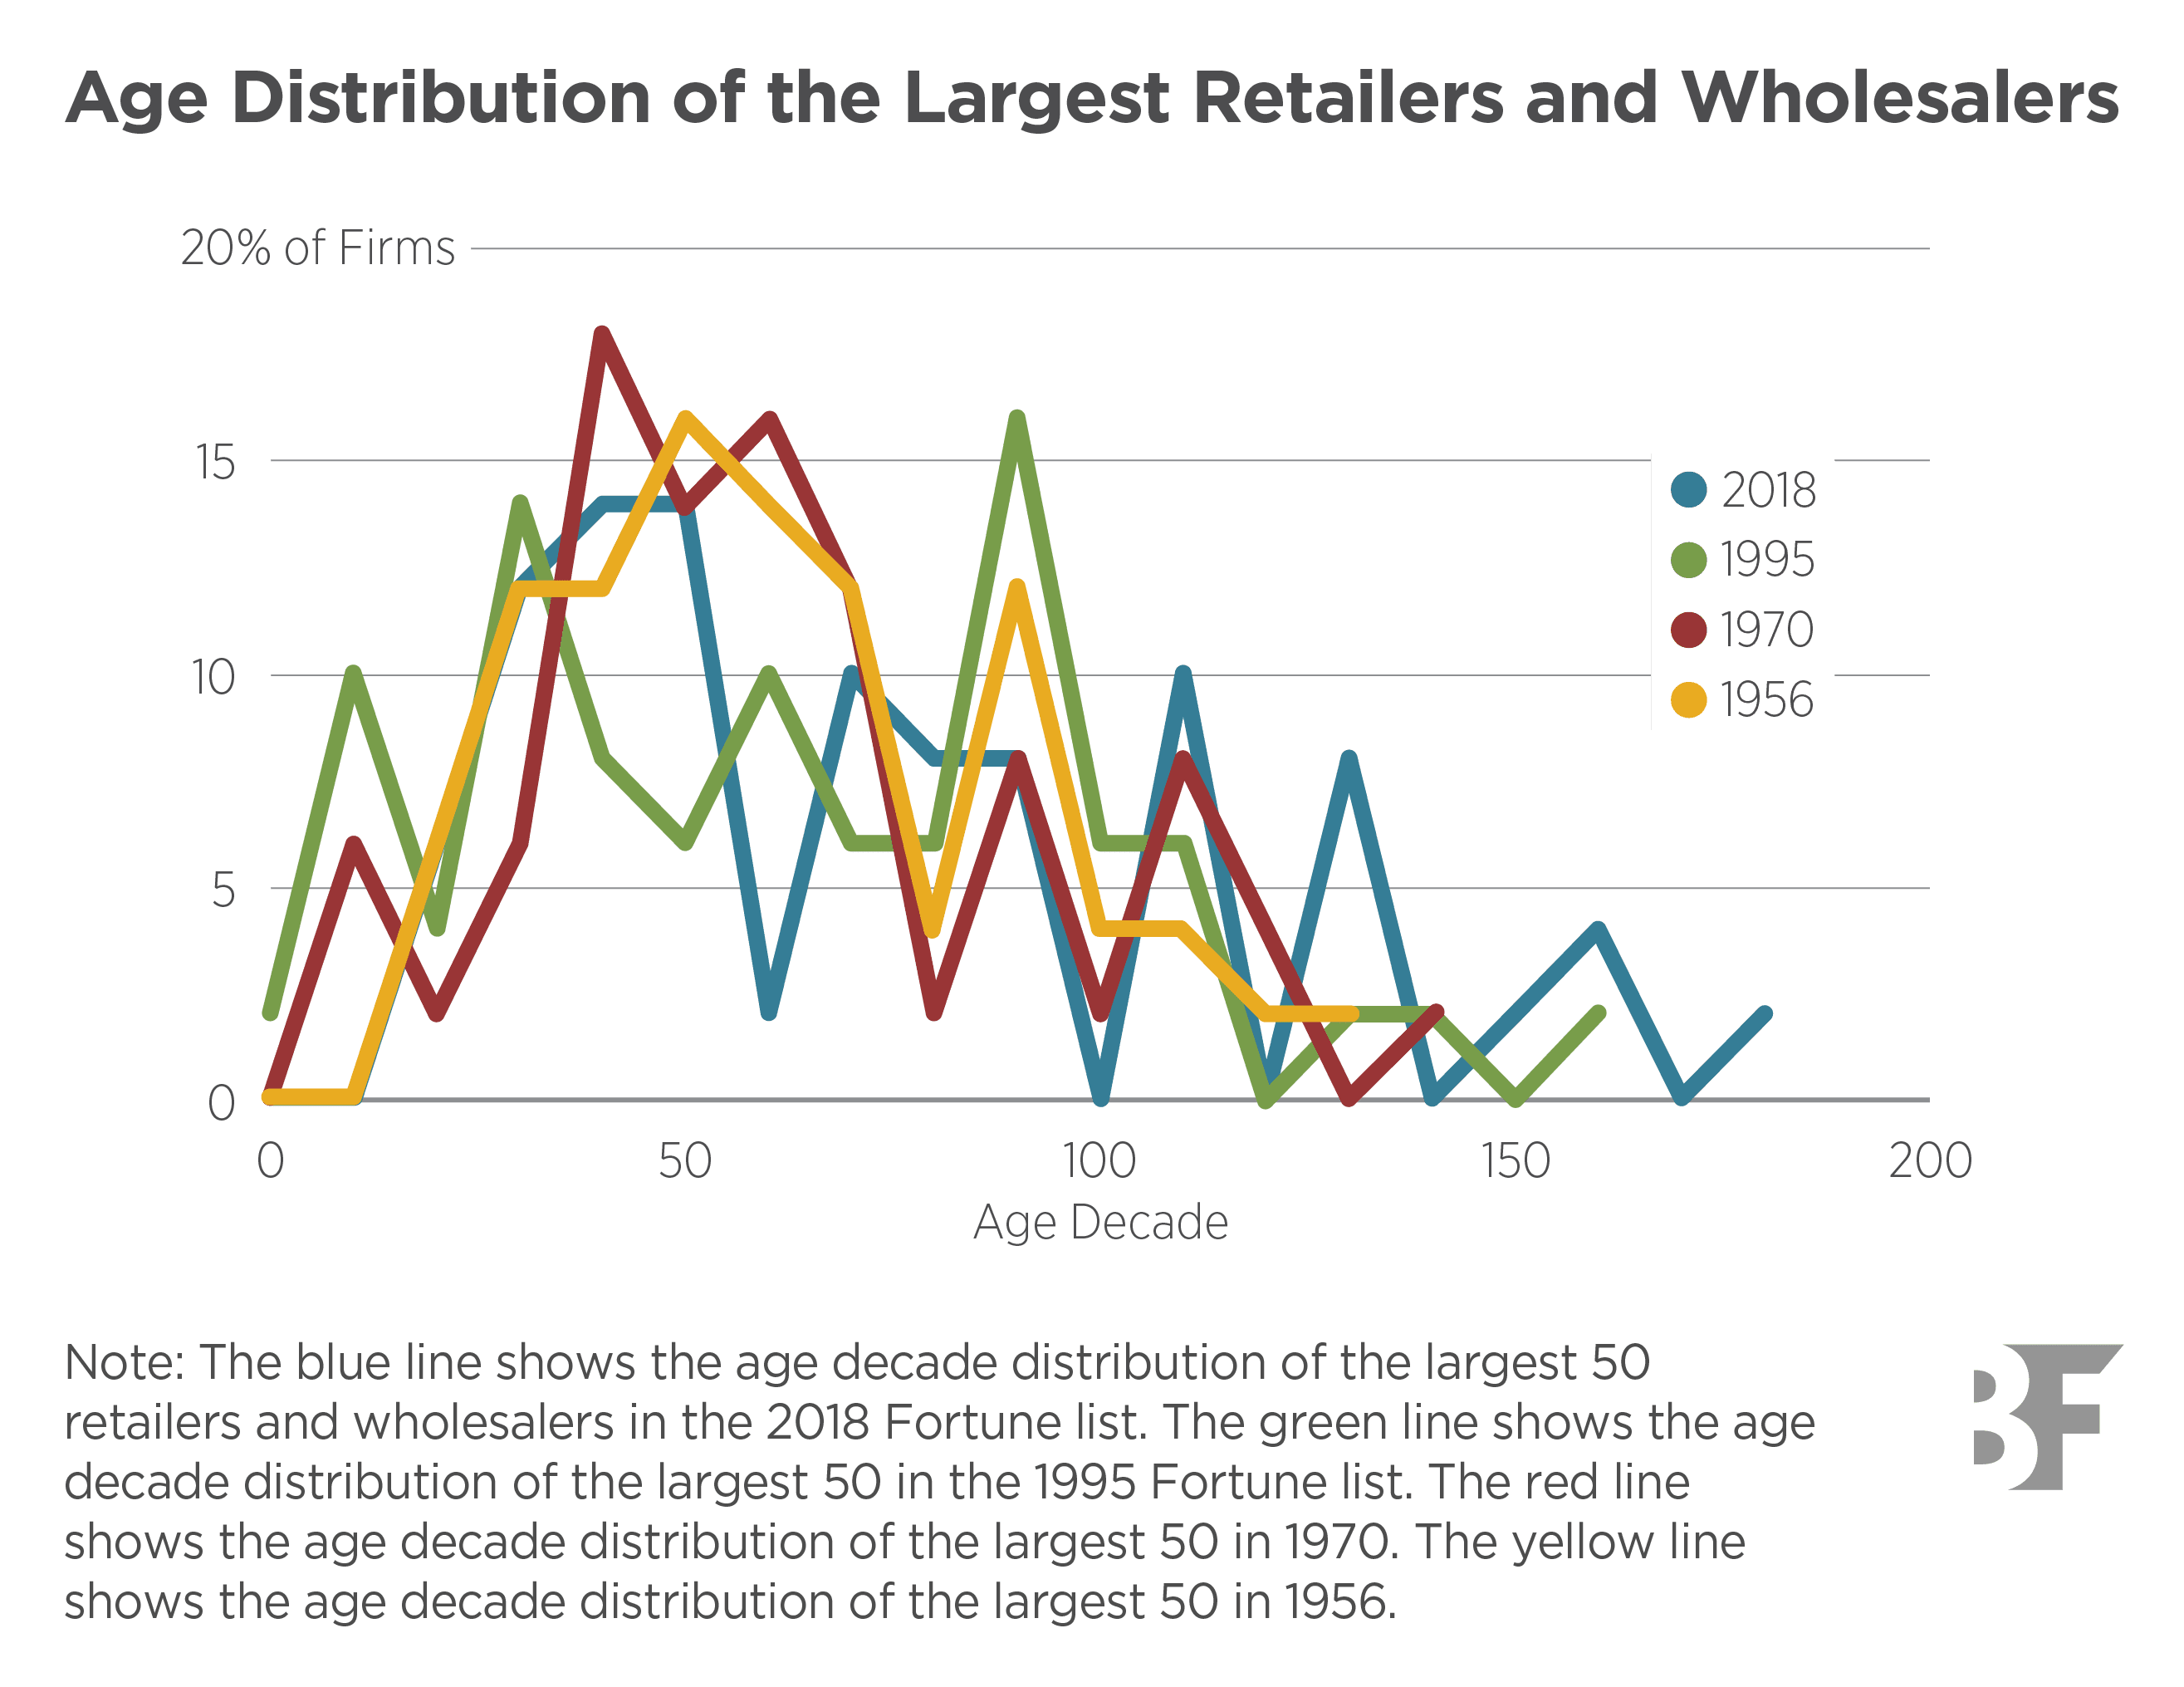
- The emergence of superstar industrial firms: firms in manufacturing and mining industries according to the Standard Industrial Classification codes, which are four-digit codes that classify a company by its economic activity in the United States is highly uneven over time—with a special generation from 1880 to 1920 (around the time of the Second Industrial Revolution: a period from around 1860 to 1900, marked by advancements in steel, electricity, and petroleum, and giving rise to large-scale industrialization and major corporations ) remaining dominant among the largest manufacturers in the 1910s, 1950s, and 2010s—but top firms still experience substantial turnover. This “special generation” has a lasting influence; the median age of top firms was around 30 in 1917, 60 in 1955, and 100 by 2018.
- However, the persistence of this special generation does not extend to individual firms. Twenty-one percent of the top industrials on the 1955 Fortune list remain on the 2018 Fortune list. Correspondingly, among the 388 industrials in the 2018 Fortune list, 137 were born between 1880 and 1920, but only 50 were among the top 388 industrials in 1955; the rest (and the majority) is represented by “late bloomers.”
- By comparison, the authors find a similar pattern in the industrial history of Germany. In the UK, though, superstar firms are relatively young today. In part, this evidence suggests that the special generation among top industrials is not just a result of country-specific regulations (given the similarities in the US and Germany), or military buildup in the world wars (which would also be relevant in the UK).
Retail and wholesale
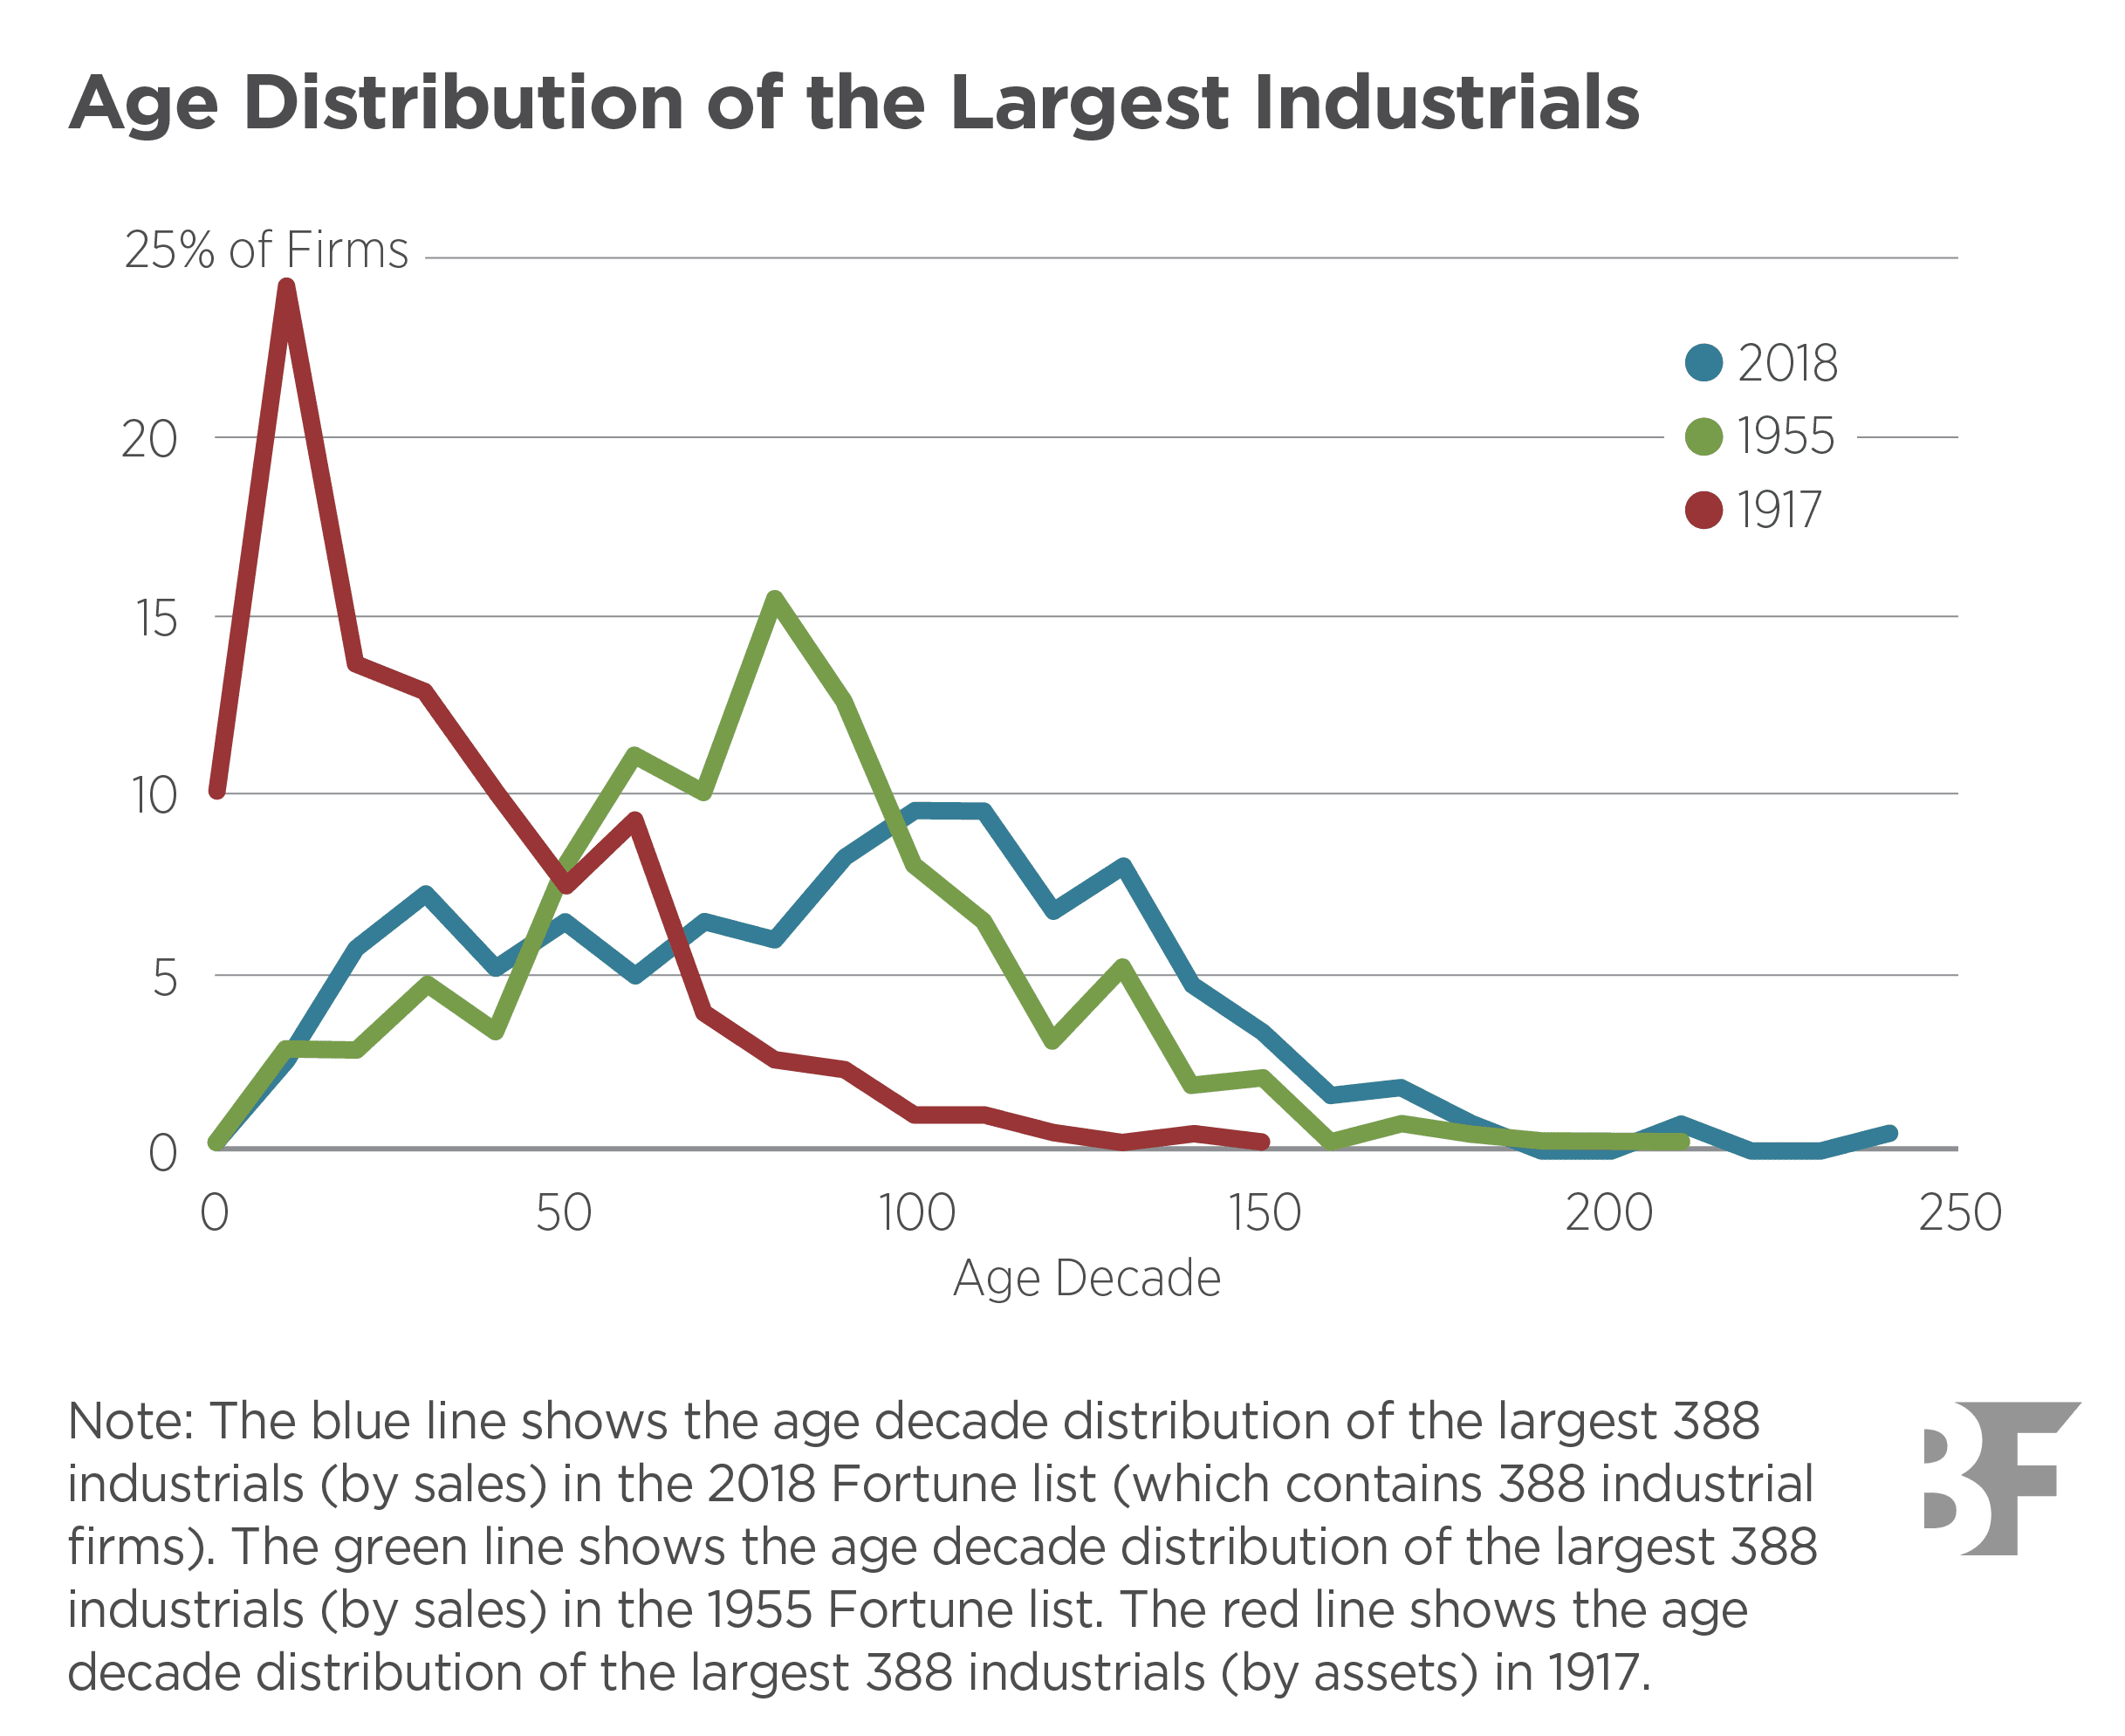
- In contrast to large industrial firms, superstar retailers and wholesalers are relatively stable in their age distribution. Today, the birth years of large retailers and wholesalers cluster around 1960 to 1980. In the 1950s, though, top companies primarily date back to around 1900.
- The authors show that the largest retailers and wholesalers have stayed 60 to 70 years old on average, without a special generation.
Service
- Today, birth years for superstar service firms cluster around 1960 to 1980, and few large ones existed before then; also, few services companies would qualify for the largest businesses in the economy until recently.
- In 2018, the large services in Fortune 1,000 are young, with a median age of 43, which resembles the youth of top industrials in 1917.
- A possible explanation for the relative youth of service superstars is that the cohort of services firms born around the Third Industrial Revolution: begun in the late 20th century, this era is characterized by the shift from mechanical and analogue technologies to digital electronics; key drivers include computers, the internet, and telecommunications forms a special generation, like the cohort of industrial firms born around the Second Industrial Revolution, but several more decades of data are necessary to confirm this account.
The authors take these data to a model of firm dynamics, which offers the following explanations for the birth and persistence of superstar firms:
- Declining adoption costs of the scalable technology generate the advantage of the special cohort relative to firms that came before;
- The accumulation of productivity over time through learning gives superstars first-mover advantages relative to potential entrants afterwards;
- Idiosyncratic firm-level shocks keep the top firms changing despite the persistence of the special generation; and
- The persistence of the special generation does not necessarily imply staleness or lack of dynamism among top firms.
Bottom line: Certain historical settings produce special generations of entrants that give rise to superstar firms for decades to come. These settings occur occasionally, and include new technologies that exhibit economies of scale, that confer low adoption costs for new entrants, and that require organizational learning. The combination of these forces produces special cohorts that have a strong edge relative to both firms that came before and potential entrants thereafter. That said, individual superstars keep churning due to idiosyncratic shocks.