


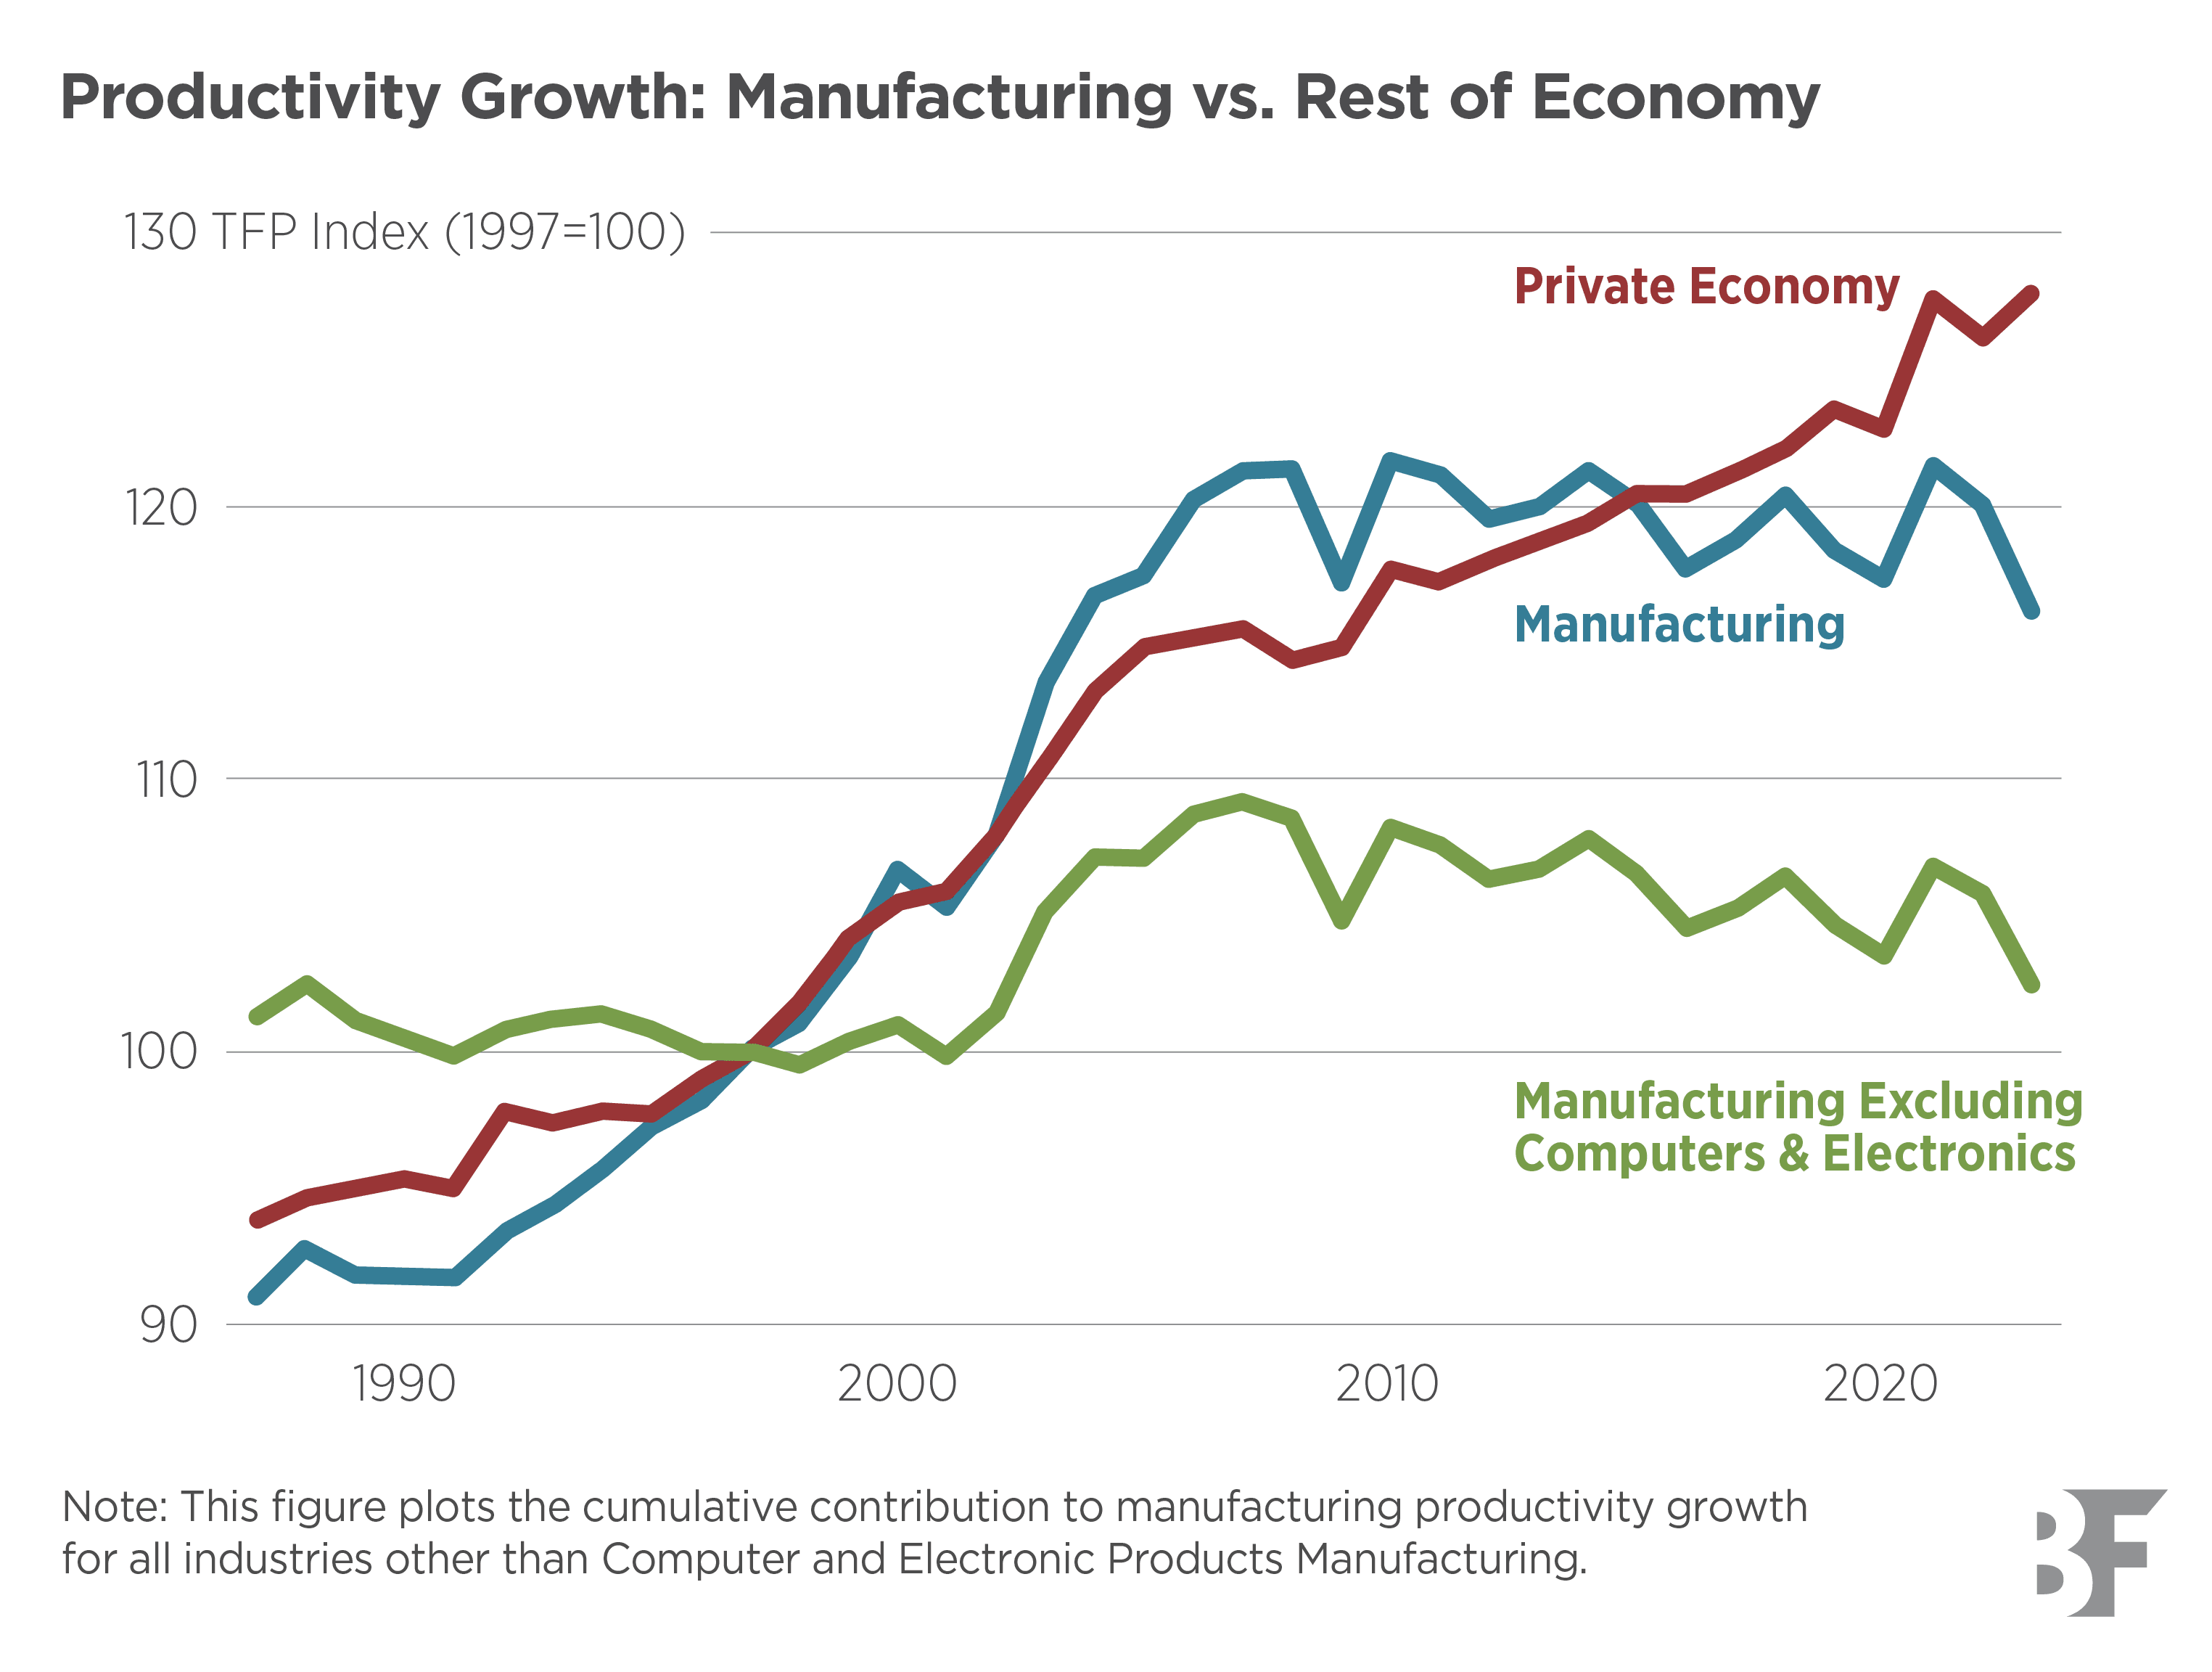
Official productivity statistics paint a picture of a manufacturing industry in decline. From 1987 to 2009, the Bureau of Labor Statistics (BLS) total factor productivity: a measure of how efficiently a firm converts inputs (labor, capital, and materials) into output, capturing productivity improvements beyond changes in input usage (TFP) index for manufacturing grew by 1.2% annually, outpacing the 0.9% growth rate of the overall private economy. But between 2009 and 2023, the pattern reversed. Manufacturing TFP fell slightly while private economy TFP continued to rise at 0.8% per year. This reversal is especially concerning given manufacturing’s traditional role as a driver of innovation across the broader economy.
In this paper, the authors examine the recent slow growth in manufacturing productivity. They begin by documenting that nearly all measured TFP growth since 1987, and its post-2000s decline, comes from a few computer-related industries. While productivity growth slowdowns are observed in multiple manufacturing industries, most of the measured sector-wide stagnation is quantitatively explained by productivity changes in Computer and Electronic Products Manufacturing.
Building on this result, the authors next scrutinize whether official productivity measures accurately capture productivity for this highly innovative industry. Traditional TFP measures calculate productivity by comparing the real: the value of money or interest rates after removing the effects of inflation, showing the true purchasing power (inflation-adjusted) value of what industries produce to the real value of the inputs they consume. To make this calculation, statisticians must convert nominal: the stated or face value of something, like money or interest rates, without adjusting for inflation dollar figures into real quantities, relying on price indices: a statistical measure that tracks how the average price of a basket of goods changes over time to strip out the effects of inflation.
These price indices must capture the frequent technological improvements within Computer and Electronic Products, or else risk undercounting the sector’s production. For example, consider a smartphone that costs $800 today and $800 five years ago. Today’s version likely has a better camera, faster processor, and more storage. When price indices fail to account for these quality improvements, they effectively treat a superior product as having the same price, missing the fact that the real (quality-adjusted) price has fallen dramatically.
This measurement error can have cascading effects, threatening to overstate inflation, understate real output growth, and make productivity gains appear smaller than they actually are. The authors hypothesize that this quality-adjustment problem is precisely what is happening in manufacturing statistics, causing conventional measures to understate productivity growth in highly innovative industries.
To test this hypothesis, the authors exploit a key institutional difference: the BLS invests more in quality adjustment for consumer price indices than producer price indices or import price indices. This is important because the last two price indexes are used to construct sector output and productivity, while consumer price indices are not. The authors compare consumer-facing prices (Personal Consumption Expenditures price index) against producer-facing prices (BEA gross output deflators and BLS import price indices) across 212 consumption categories and 414 commodities, using instances where consumer indices show steeper price declines than producer indices to identify unmeasured quality improvements.
To translate these price gaps into productivity estimates, the authors use input-output tables: an economic accounting framework that maps which industries supply inputs to which other industries across the entire economy , which track what each industry buys from other industries, allowing them to trace the impacts of mismeasurement across the entire economy.
They find the following:
- Producer and import price indices understate quality growth. Comparing consumer-facing and producer-facing price indices for the same products reveals systematic gaps in rapidly innovating industries. For computers and electronics, consumer price indices show far steeper price declines than producer or import price indices, indicating that official producer deflators fail to capture quality improvements. This means measured inflation is overstated and real output growth is understated in these industries.
- Manufacturing productivity is systematically understated. Using an input-output framework to account for price mismeasurement in both outputs and inputs, the authors estimate that manufacturing TFP growth is understated by approximately 0.8 percentage points annually. The mismeasurement is concentrated in durable goods manufacturing (understated by 1.6 percentage points) with smaller effects in nondurable manufacturing (0.5 percentage points). No significant mismeasurement appears outside the manufacturing sector.
The manufacturing sector has undergone profound transformation over the past quarter century. Employment has collapsed by more than one-quarter since 1997 even as private nonfarm employment grew by more than one-quarter. The sector has become increasingly import-reliant—first from China, then from Vietnam and Mexico—more capital-intensive, and more robot-intensive. Assessments of manufacturing’s evolution, and evaluations of the billions spent on federal support programs like SEMATECH, Manufacturing USA, and the CHIPS Act, hinge on properly measuring real output and productivity.